Strategies for Improving Table Games Performance Through Operational Efficiency
Table games performance is often viewed through the lens of game mix and staffing. While these factors matter, many meaningful gains come from improving how casino operations teams respond to patron demand, both in real time and through better planning of spreads and game mix. Stronger performance comes from consistently aligning these decisions to demand.
With modern analytics and performance tools, operators can turn table games yielding into a structured, repeatable process that enables clear, timely decisions and drives tangible performance gains.
In practice, efficient table game operations requires 4 key pillars:
- Table games operational data and visibility
- Real time execution
- Workforce planning
- Game mix decisions
Operational Data Visibility as the Foundation for Operational Efficiency
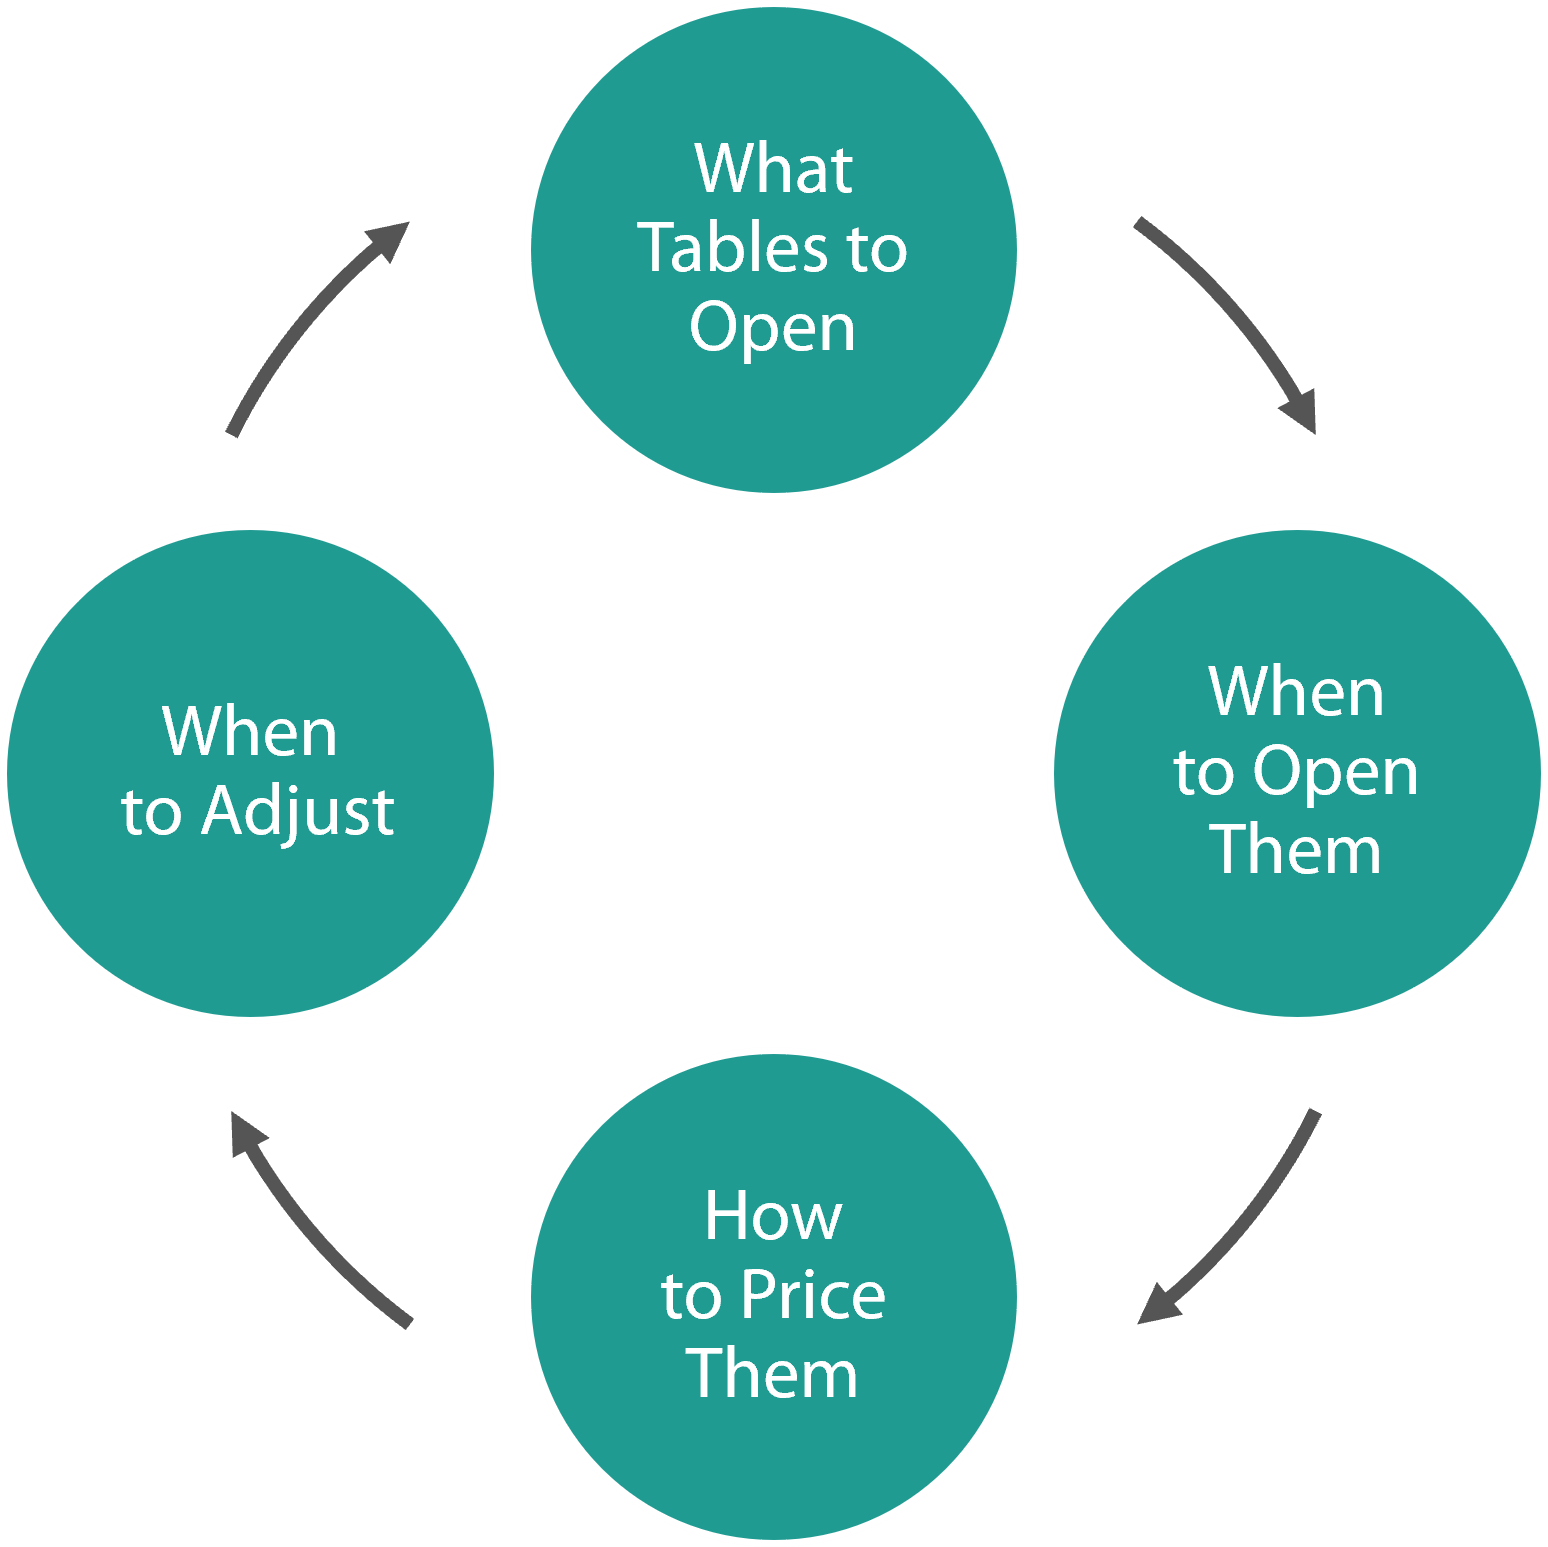
Table games yielding is fundamentally a decision cycle: which tables to open, when to open them, how to price them, and when to adjust pricing.
Traditional reporting is backward-looking and doesn’t support the decision cycle at the time that decisions are being made. It explains performance after patrons have already left and does not help a casino floor team answer the real question at the moment:
What should we change right now to capture demand and protect casino floor performance?
Traditional tools also struggle to forecast demand or model profit scenarios using real operating constraints. As a result, spread plans and pricing decisions are often built on weak assumptions, leaving significant opportunity on the table. The real question operators need answered is:
How should we adjust schedules to align staffing and spreads to maximize profit by game, pit, and shift using our real open hours, labor cost, and capacity constraints?
Tangam’s analytics platform supports real time and forecasted patron visibility to eliminate the gap between traditional reporting approaches and table game yield decision cycles, both in real time and for future planning.
Real-time Yielding: Why Manual Execution Breaks Down
Most casinos “yield” manually with Floor Managers adjusting minimums and spreads based on experience and intuition. The challenge is that manual yielding fails in predictable ways:
Inconsistent Actions from Manual Yielding
The corresponding actions taken by teams to the perceived demand changes varies across teams and results in varying outcomes depending on who is managing the floor.
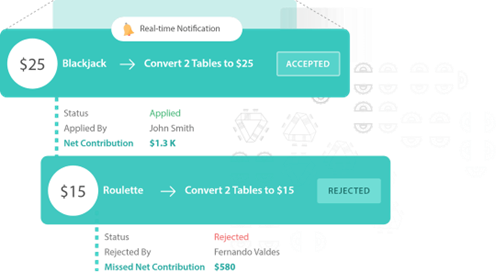
Real time yielding with a platform like Tangam delivers recommendations to the pits based on forecasted demand and refines them in real time as actual demand shifts. The platform prompts teams with specific actions to adjust pricing using property tuned profit models and operator defined guardrails that support strategic objectives. This enables operations teams to execute consistently in a way that balances player experience with financial performance.
Example: Real Time Yield Action Notification to Floor Operators
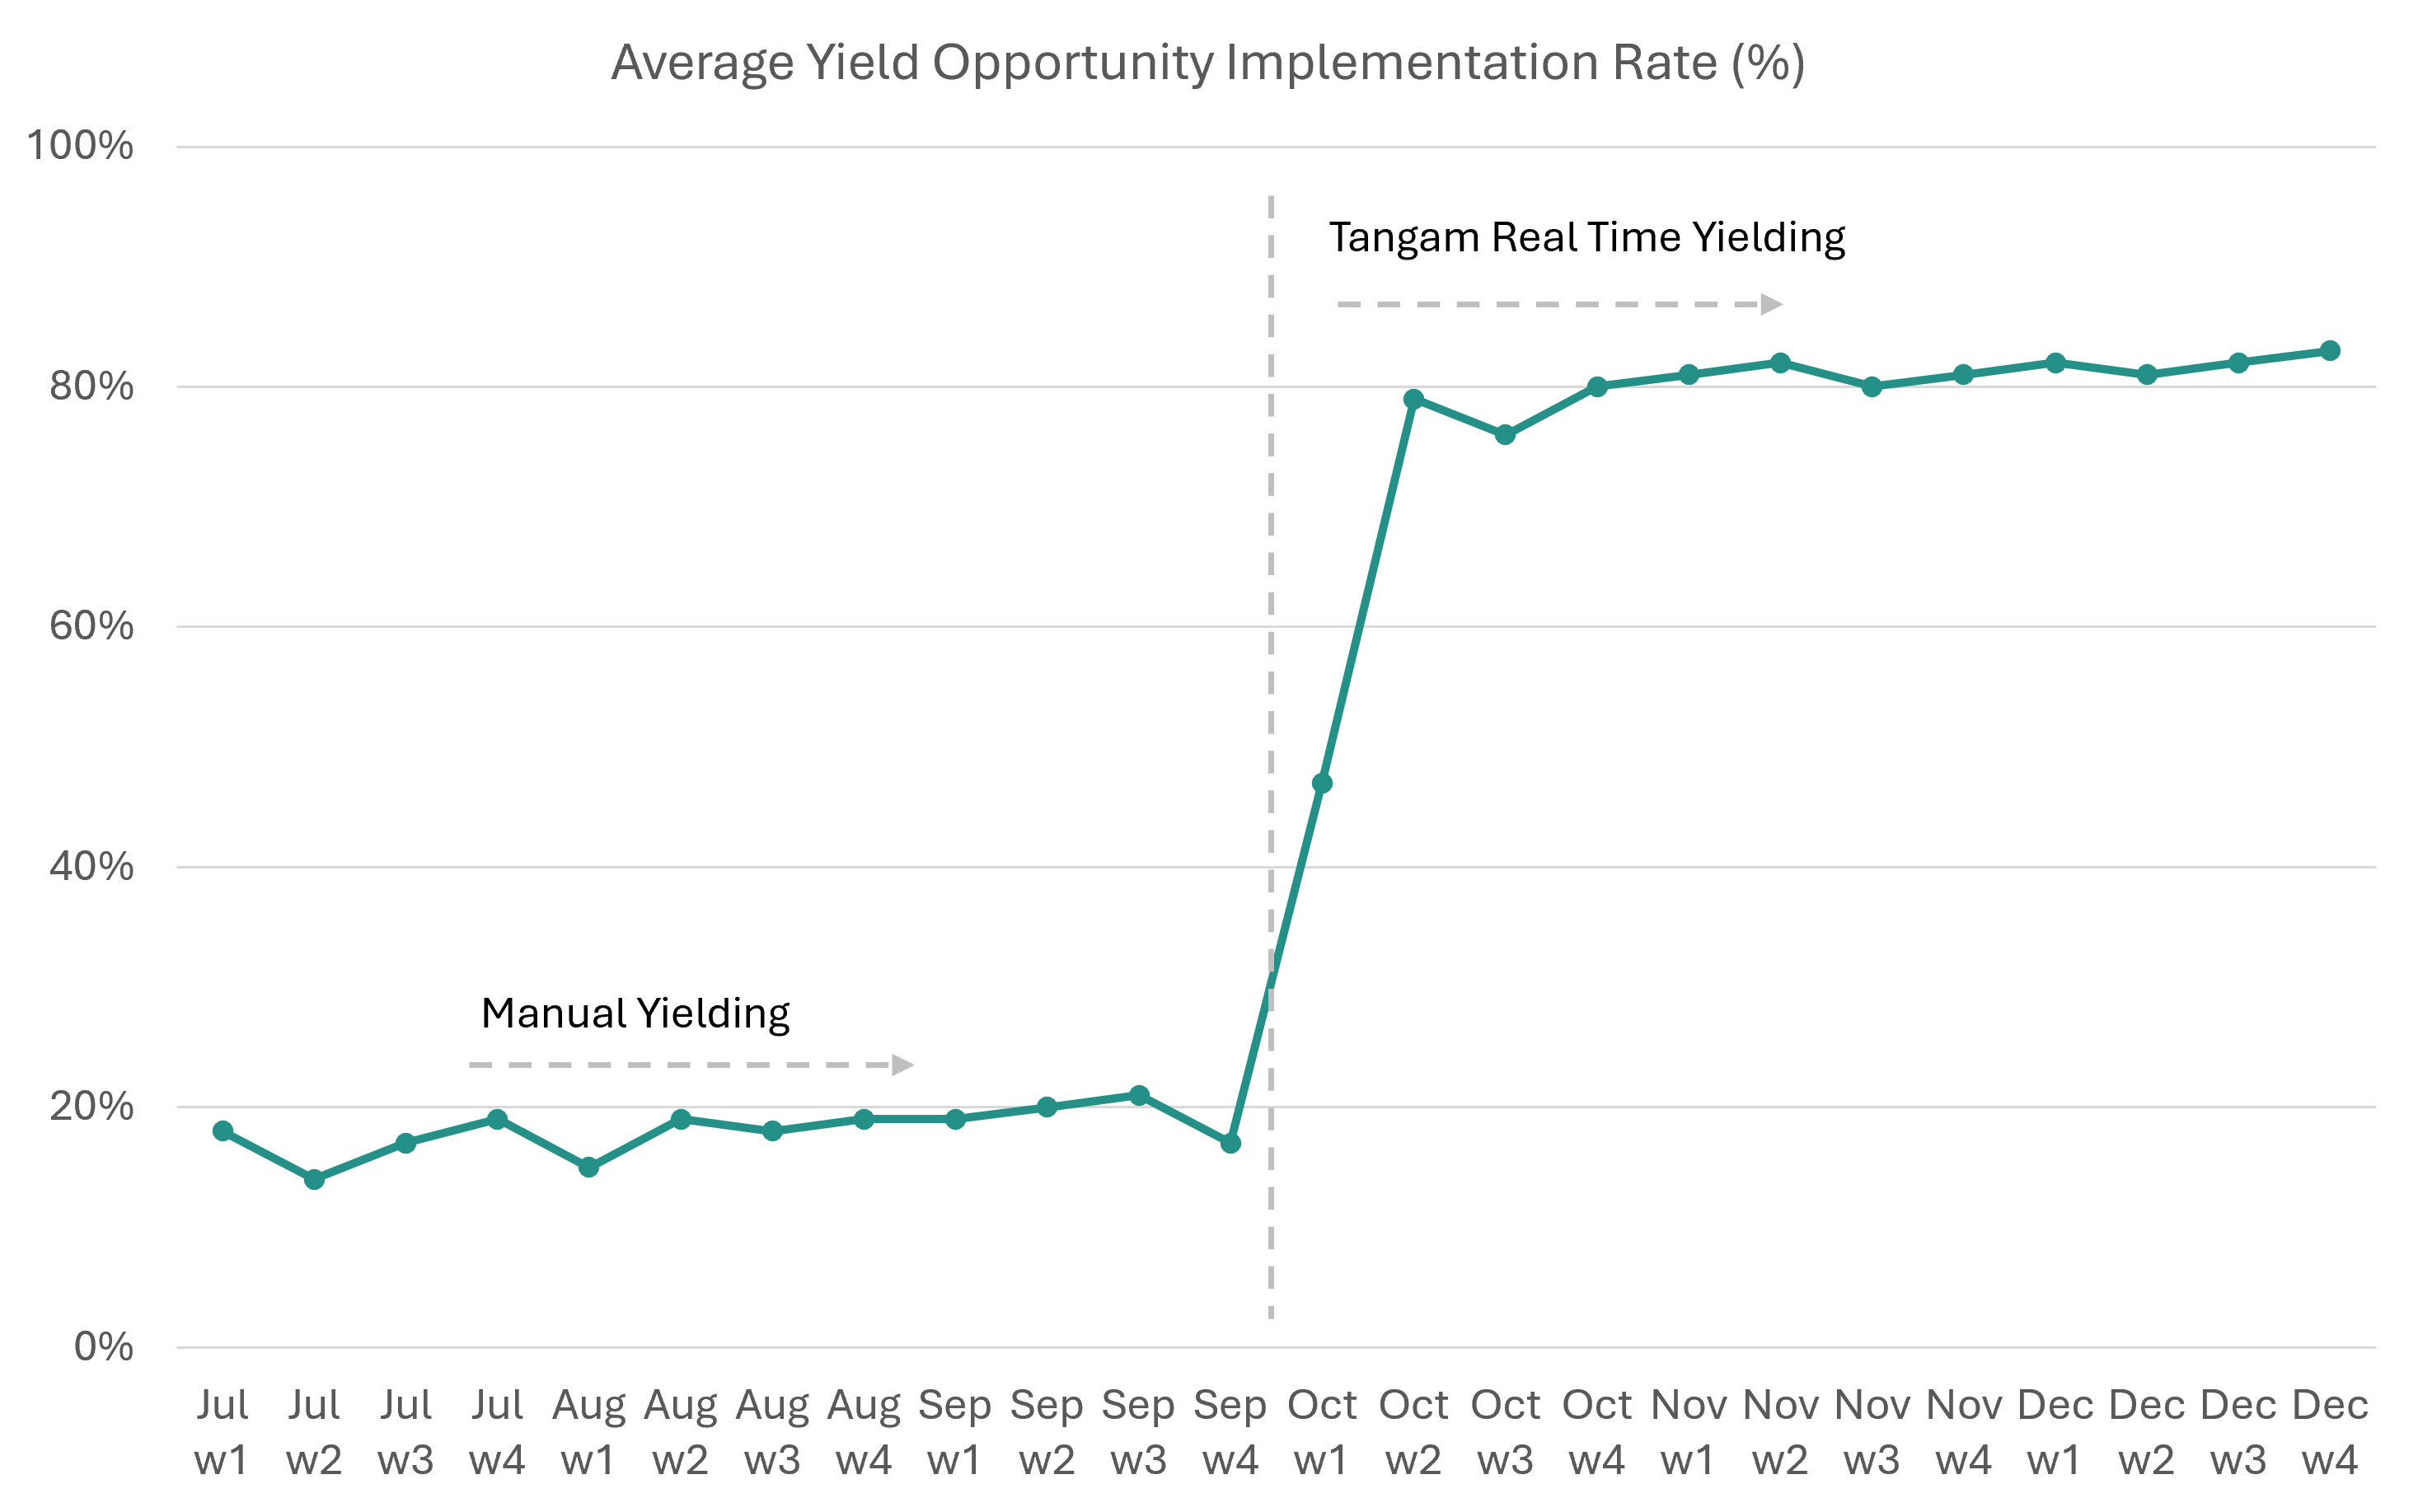
An analysis was performed to evaluate how many of the validated opportunities for yield improvements were implemented by an operations team for 3 months before and then 3 months after implementing Tangam’s casino operations platform. Prior to having real time notifications with recommended yield action, the operations team implemented nearly 20% of the optimization opportunities through gut feel and experience. After implementation of the real time yielding platform, the implementation rate jumped, with 80% of the total opportunities for increased financial performance being implemented by the operations team.
The line graph below shows the increase in average weekly implemented rate of the calculated optimization activities from 20% before software implementation to over 80% after software implementation in October Week 1.
Delayed Responses to Demand Shifts Through Manual Yielding
Typically, with manual yielding activities, the demand shifts faster than decisions get made and the opportunity for additional EBITDA gains have likely passed.
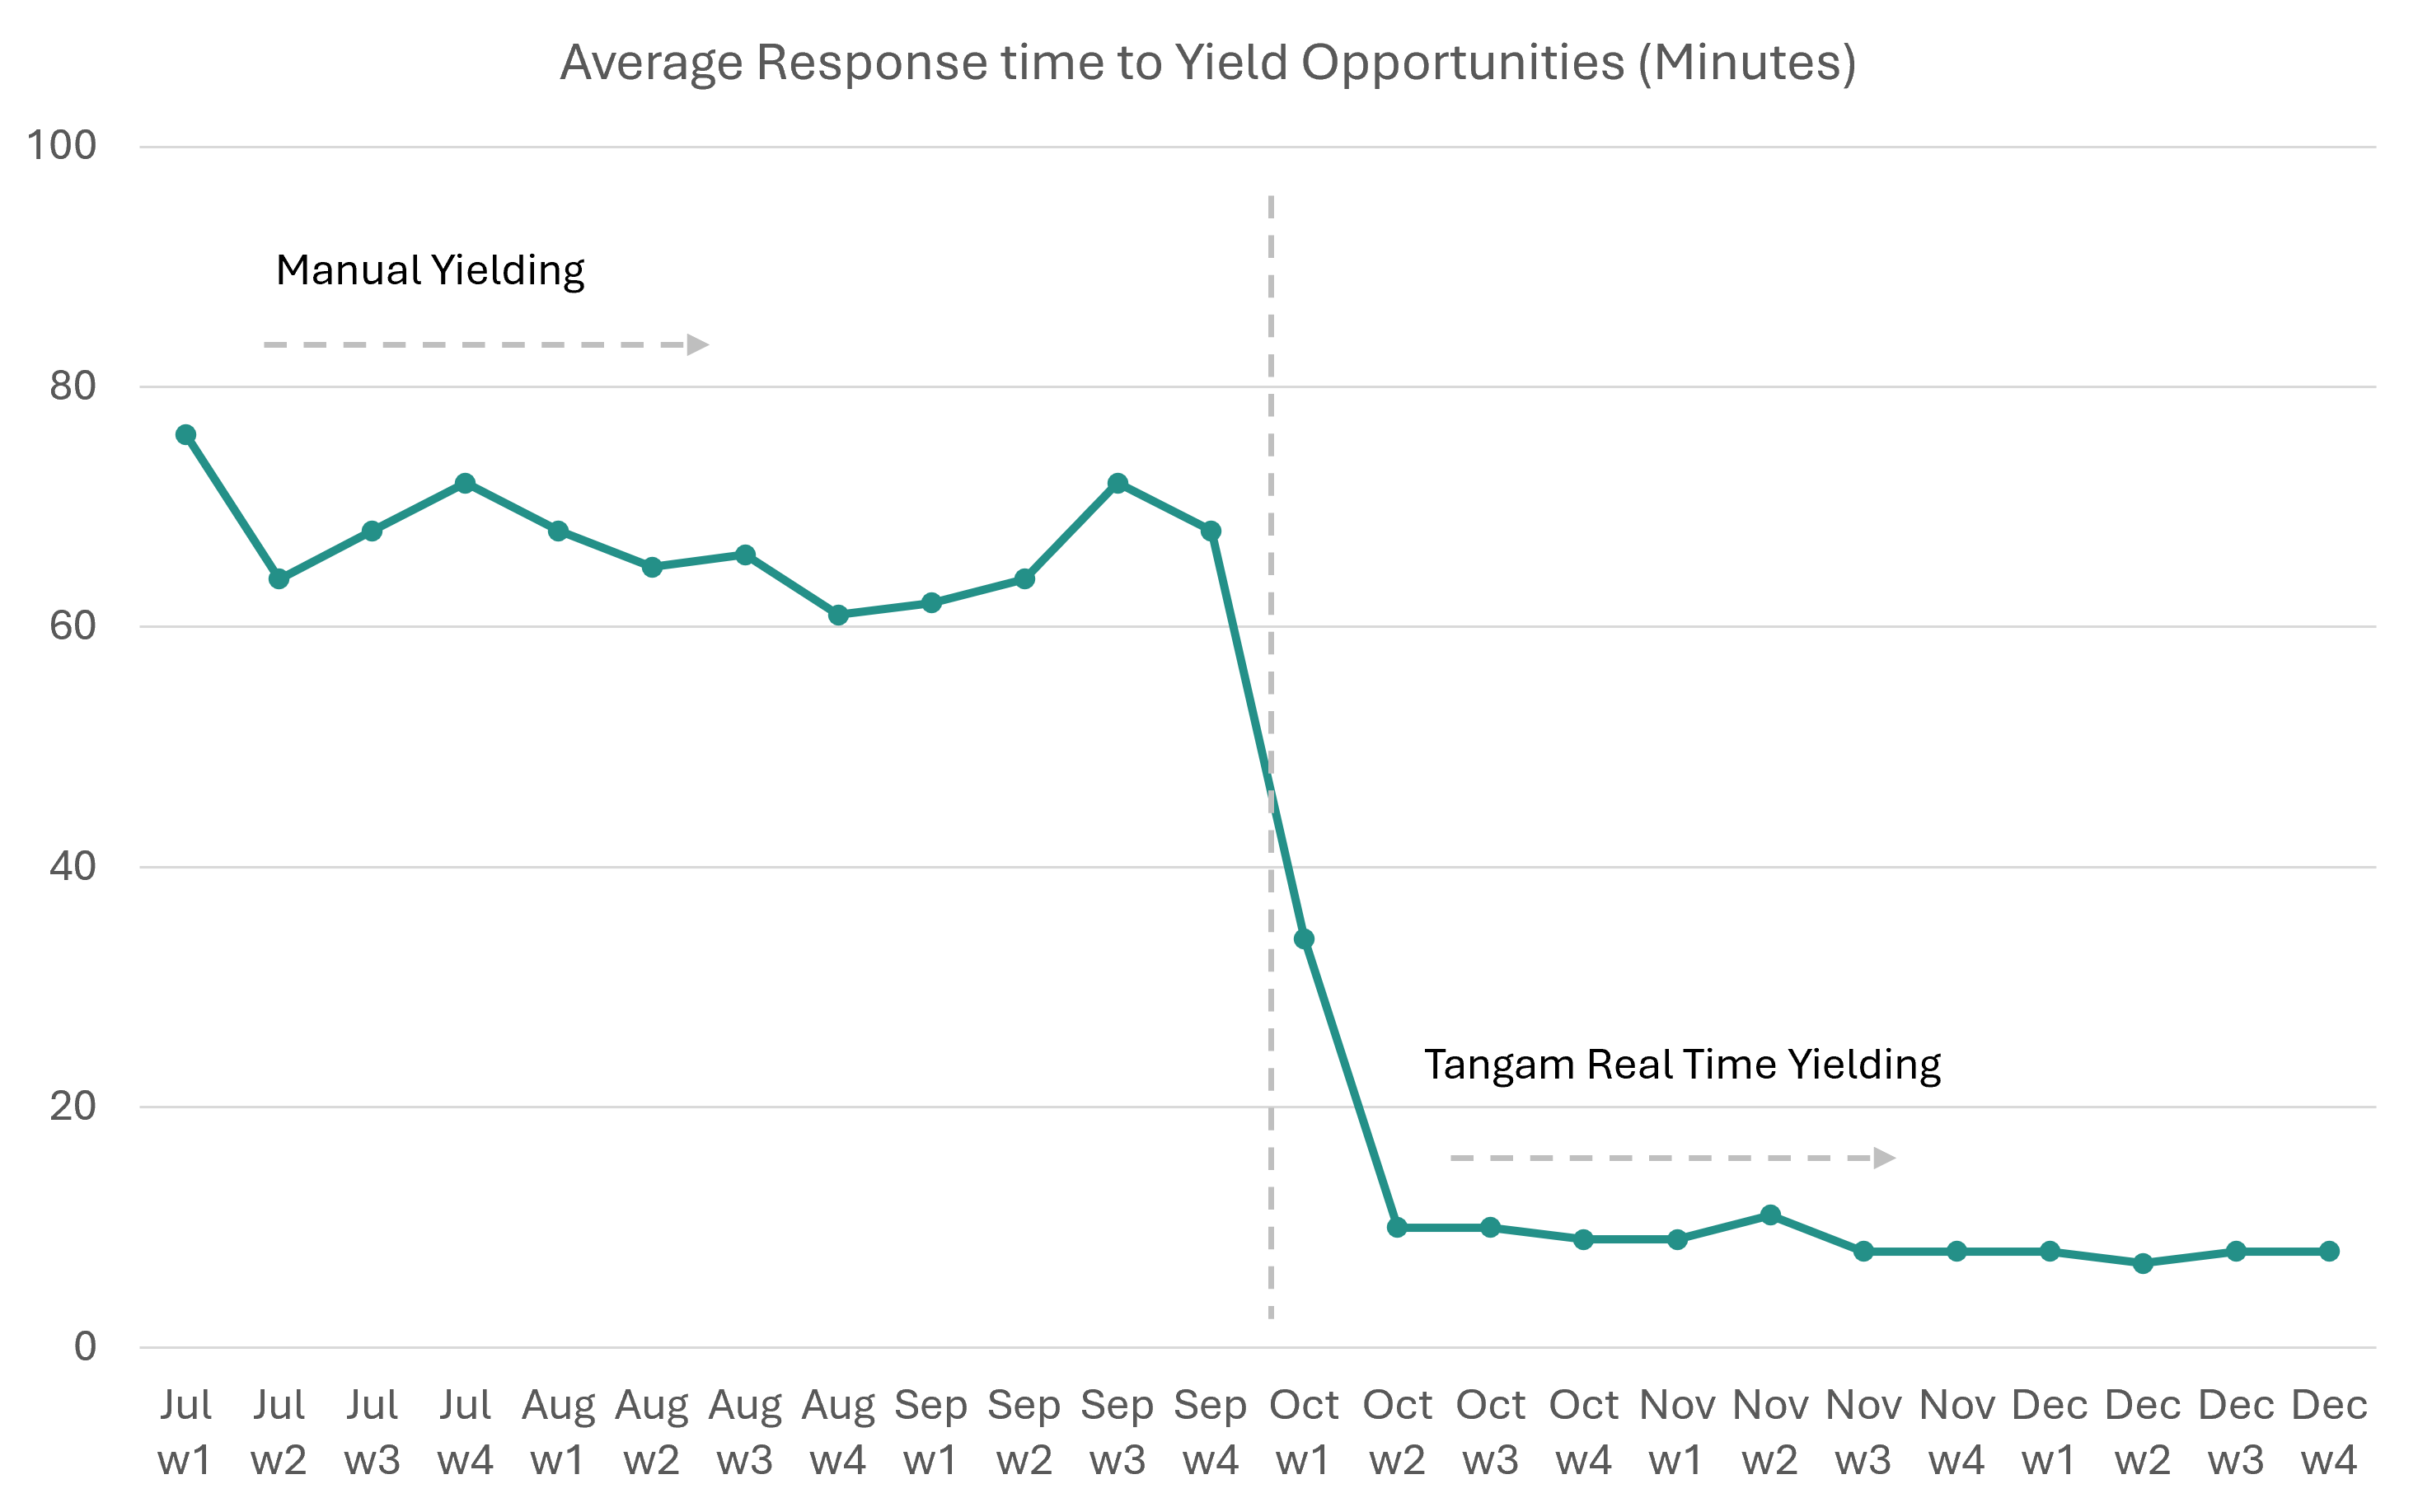
In the same analysis mentioned earlier, the average time to implement a validated opportunity through manual yielding practices was 67 minutes through the 3-month monitored period. After implementing Tangam’s real time yielding solution, the average time to implement was reduced to under 9 minutes for an 87% reduction in response delay. In short, Implementation effectiveness increased 4x while response time improved by over 8x.
The graph below shows the average weekly time to implement validated yielding opportunities for the 3 months before and 3 months after implementing a real time yield management platform.
Impact of Manual Yielding on Net Profit Contribution
With automated real time yielding, the operations team nearly doubled the number of recommendations implemented to 2 per hour and implemented them 8 times quicker than when they were manually yielding. This performance improvement drove $150,000 per week in incremental net contribution which extends to over $7M per year in additional profit contribution. This demonstrates that consistently executing adjustments to open hours, spreads, pricing, and game mix in response to real time demand can drive meaningful financial performance improvement.

Limited Visibility and Training Opportunities with Manual Yielding
Manual yielding relies on individual judgment and informal decision making that is rarely documented, which limits visibility into what actions were taken, when they were made, and what impact they had. This makes it difficult to create accountability or identify consistent training opportunities across teams.
Real time yielding platforms provide structured prompts and track responses, including whether recommendations were accepted, how quickly they were implemented, and what outcomes followed. This creates a clear record of execution that supports accountability, reinforces best practices, and enables ongoing coaching and performance improvement.
Data Quality Limitations with Manual Yielding
Manual yielding decisions are rarely documented, which often leads to incomplete or inconsistent operational data. Limited visibility into what actions were taken and how effective they were makes it difficult to measure impact and weakens both reporting and future planning.
Real time yielding introduces a structured execution loop that naturally improves data quality. When teams respond to recommended actions, they confirm current table conditions such as occupancy, pricing, and wager levels before implementing changes. This helps ensure that operational data reflects actual floor conditions at the moment decisions are made.
Over time, this creates a more accurate and reliable dataset that strengthens downstream activities such as performance reporting, planning, benchmarking, and operational diagnostics.
Smart tables can further enhance this process through reduced manual capture and shorter time between demand signals and execution, helping data stay aligned with real floor activity.
Summary of Limitations from Manual Yielding
Manual yielding relies on individual judgment and informal adjustments. Decisions are typically triggered by perception rather than measured demand, which can lead to delayed responses, inconsistent execution across teams, and limited visibility into what actions were taken or why. Without structured tracking, it is difficult to measure outcomes, reinforce best practices, or ensure alignment with property strategy.
Real time yielding shifts the approach from intuition to demand aligned execution. Decisions are guided by actual and forecasted demand, supported by defined guardrails, and implemented in a timely manner. Actions and outcomes are tracked, creating accountability and a clear record of execution.
In practice, this enables faster pricing and spread adjustments, more consistent performance across shifts, improved accountability, and stronger capture of peak demand within existing operating constraints.
Workforce Planning: Fixing Planning Inefficiency
When spreads and dealer rosters are built using static templates rather than demand driven profit and constraint modeling, planning decisions often reflect historical assumptions instead of current opportunity. This can result in inefficiencies where tables are open at the wrong times or labor is misaligned with demand.
Tangam’s table games planning capabilities approach spread planning as a profit exercise. Forecasted patron demand and segment specific profit models are combined with real operating constraints such as table capacity and shift structures to produce plans that are both achievable and performance focused.
This approach helps identify where performance gaps originate. For example:
- Shift design may not align with demand patterns
- Capacity constraints may limit opportunity
- Execution may diverge from planned rosters
With structured analytics, planning becomes faster, more accurate, and aligned with forecasted demand.
Example: Casino optimization solutions should be able to review the actual capacity against the ideal capacity to understand and quantify the gaps. The chart below shows the overspread and underspread differences between manual scheduling (black dashed line) and Tangam’s mathematically optimized scheduling (green line).
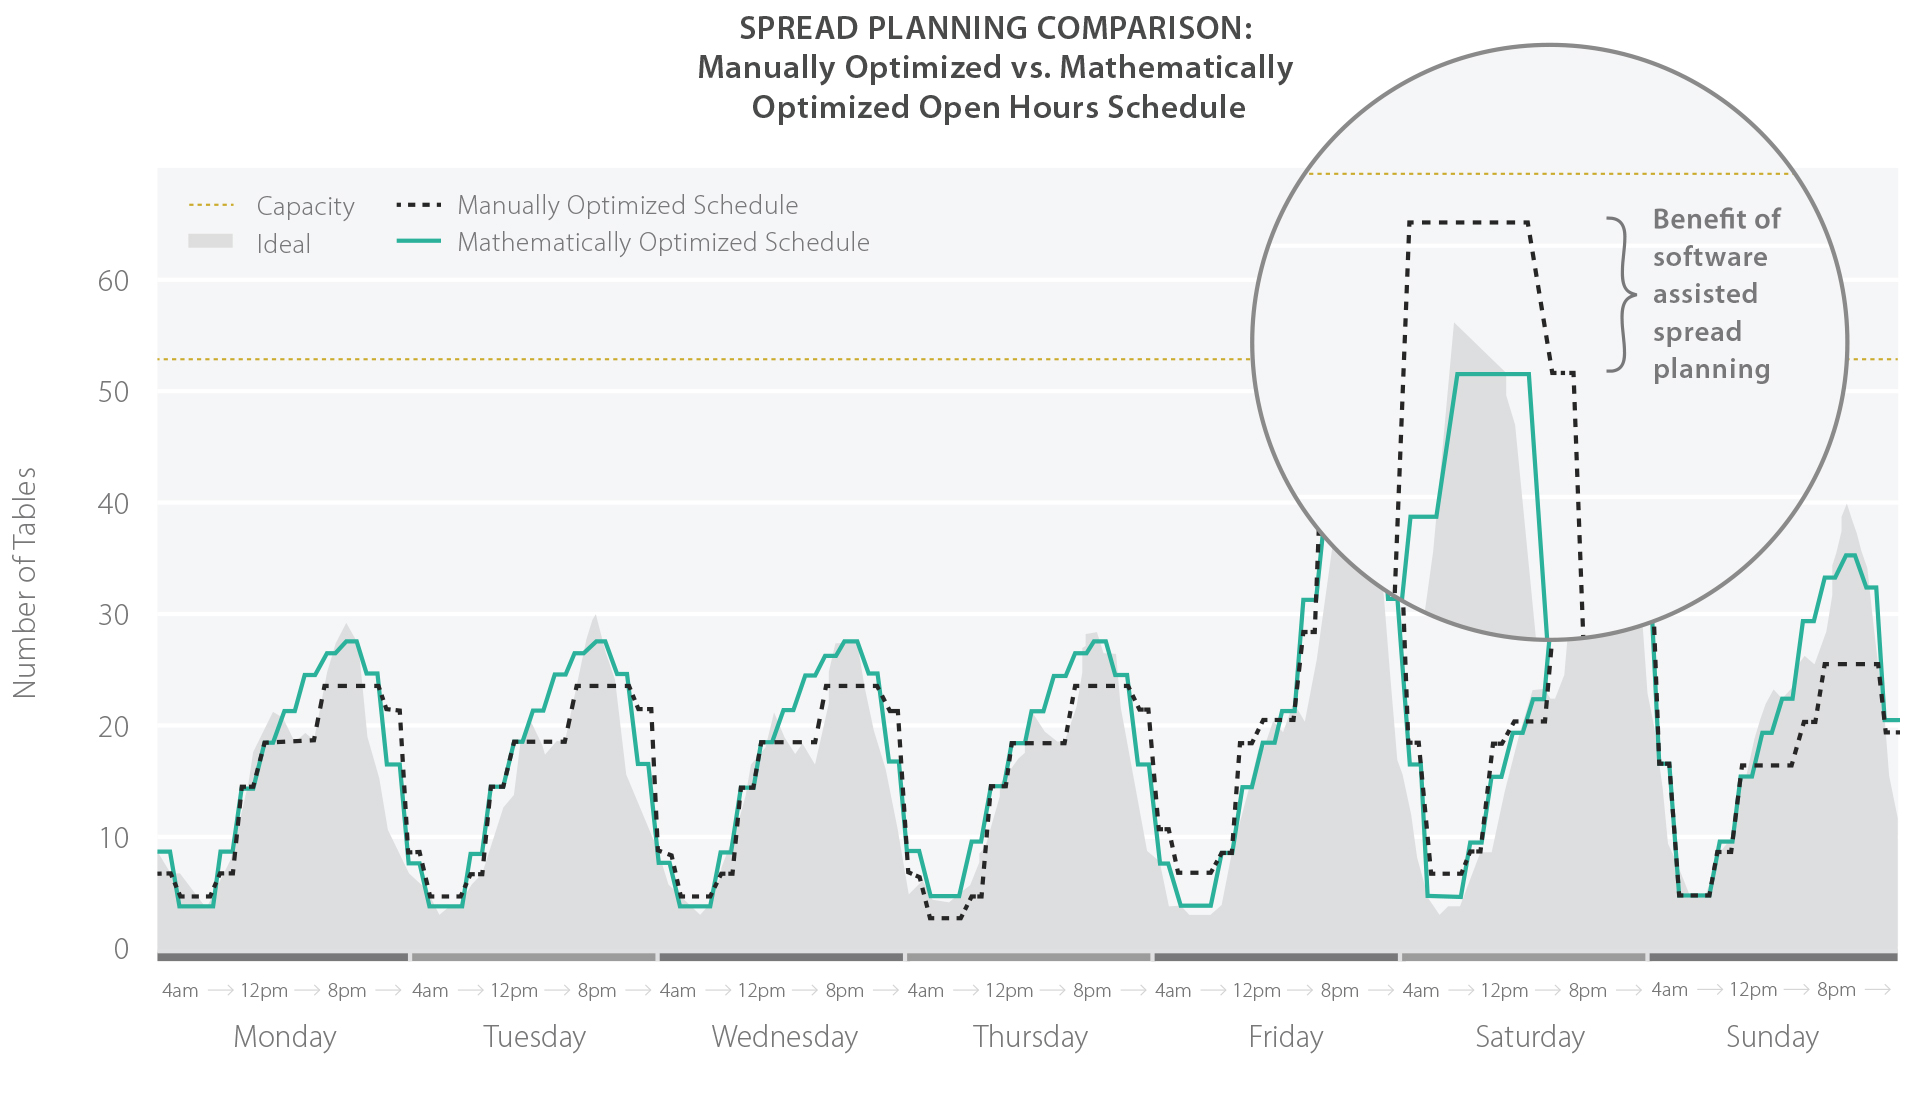
Scheduling can then be analyzed to identify periods where tables are overspread and create unnecessary labor expenses. These resources can be reallocated to times when demand regularly exceeds supply, improving both efficiency and revenue capture.
Example: Overspread Periods (Number of Tables by Time and Day)
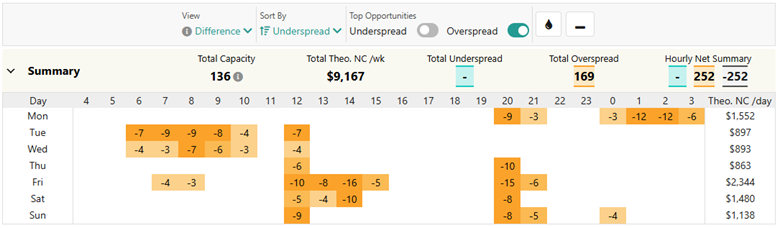
These resources can be reallocated to times when demand regularly exceeds supply, improving both efficiency and revenue capture.
Example: Underspread Periods (Number of Tables by Time and Day)
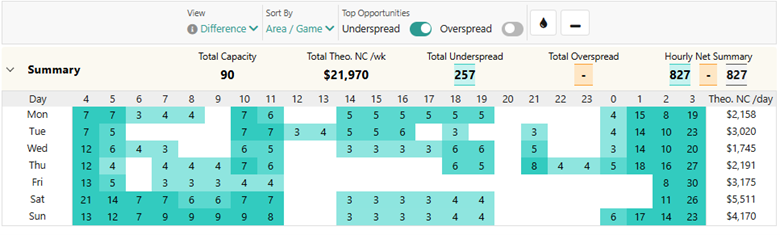
This turns planning from a fixed schedule into a demand aligned strategy that improves efficiency and captures more revenue.
Game Mix Planning and Floor Diagnostics: Knowing Where to Act
Table game mix decisions are often made using high level financial reports that reflect outcomes rather than the operational drivers behind them. This can result in adjustments that address symptoms instead of the underlying opportunity.
A more structured approach layers in deep operational data such as table occupancy, patron hours, open hours, and table pricing so decisions reflect the true controllable levers rather than summary results. Additionally, generating placement context through heat mapping helps determine whether performance is influenced by demand, capacity, or location.
This level of visibility makes it easier to distinguish between:
- A true capacity constraint
- An opportunity to reallocate resources
- A simple table move aligned to demand
Tangam’s floor performance tools bring operational metrics and financial results into the same view, allowing teams to evaluate game mix decisions with greater clarity. With the right context, game mix adjustments shift from reactive changes to demand aligned actions that support both player experience and financial performance.
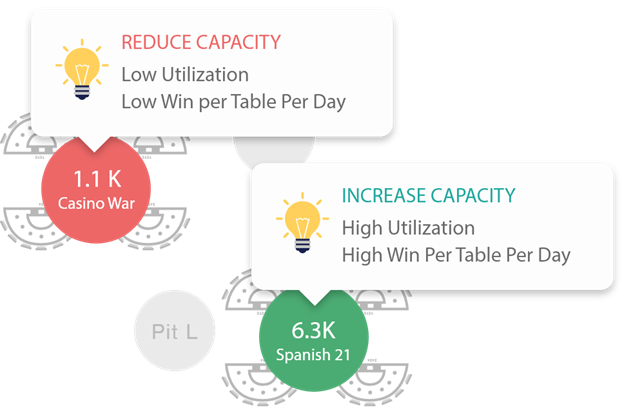
Example: Placement Context with Helps Understand Where to Reduce Capacity and Where to Increase Based on Win Per Table Per Day or other Performance KPIs:
The Common Thread: Demand Aligned Execution Drives Measurable Performance Improvements
Sustainable table games performance comes from consistently aligning operational decisions to patron demand. When demand is clearly understood, it can guide:
- Real time execution that supports timely adjustments as conditions change
- Workforce planning that aligns labor and capacity with expected opportunity
- Game mix decisions that respond to operational signals rather than summary outcomes
Together, these elements shift yielding from intuition-based adjustments to structured execution grounded in demand. Smart tables can further improve the timeliness and accuracy of demand signals, but value is created when that understanding translates into clear actions that are implemented consistently and measured over time.
Improving table games performance does not require expansion to be meaningful. With a clear understanding of patron demand, operators can improve yield through better decisions made faster and more consistently. In tighter operating environments, this approach is becoming less of a competitive advantage and more of a foundational operating discipline.
You Might Also Like...
You Might Also Like...
What Clients Say About Us
Caesars Entertainment
Melissa Price
SVP of Corporate Gaming
“[Tangam’s] real-time data gives us a deeper insight that allows us to quickly adjust to customer needs, while also establishing new business goals and tracking the success of our strategy.”
Mohegan Sun
Jeff Hamilton
President and General Manager
“Reporting alone doesn't provide answers. We chose SODA for its highly differentiated offering that provides a clear set of actionable recommendations, which maximize gaming performance and the guest experience.”
Rush Street Gaming
Cliff Ehrlich
Chief Operating Officer
TYM and SODA have demonstrated their value time and again at our properties. By scaling their deployment across our entire portfolio, we are ensuring that all our casinos benefit from the same level of optimization and actionable insights that have already proven successful at Rivers Casino Philadelphia and Rivers Casino Des Plaines.”
Mohegan Sun
Jeff Hamilton
President and General Manager
“Reporting alone doesn't provide answers. We chose SODA for its highly differentiated offering that provides a clear set of actionable recommendations, which maximize gaming performance and the guest experience.”
Mohegan Sun
Jeff Hamilton
President and General Manager
"Extending our partnership with Tangam to our full gaming operation, including tables and slots, was a no-brainer given Tangam's proven track record of business support."
Crown Casino Melbourne
Sean McCreery
Executive General Manager of Table Games
“TYM proved its value to Crown by improving operational efficiency, assisting in delivering both revenue growth and labour efficiencies by helping to ensure the best possible game occupancy and availability for valued patrons.”
The Star - Sydney
David Croft
General Manager Product & Strategy
“Due to our ongoing success with Tangam at Sydney, we’re able to deliver the right product at the right time, leading to improvements in efficiency, transparency, decision-making and our bottom line.”
What Clients Say About Us
Caesars Entertainment
“[Tangam’s] real-time data gives us a deeper insight that allows us to quickly adjust to customer needs, while also establishing new business goals and tracking the success of our strategy.”
Melissa Price
SVP of Corporate Gaming
Mohegan Sun
“Reporting alone doesn't provide answers. We chose SODA for its highly differentiated offering that provides a clear set of actionable recommendations, which maximize gaming performance and the guest experience.”
Jeff Hamilton
President and General Manager
Rush Street Gaming
TYM and SODA have demonstrated their value time and again at our properties. By scaling their deployment across our entire portfolio, we are ensuring that all our casinos benefit from the same level of optimization and actionable insights that have already proven successful at Rivers Casino Philadelphia and Rivers Casino Des Plaines.”
Cliff Ehrlich
Chief Operating Officer
Mohegan Sun
“Reporting alone doesn't provide answers. We chose SODA for its highly differentiated offering that provides a clear set of actionable recommendations, which maximize gaming performance and the guest experience.”
Jeff Hamilton
President and General Manager
Mohegan Sun
"Extending our partnership with Tangam to our full gaming operation, including tables and slots, was a no-brainer given Tangam's proven track record of business support."
Jeff Hamilton
President and General Manager
Crown Casino Melbourne
“TYM proved its value to Crown by improving operational efficiency, assisting in delivering both revenue growth and labour efficiencies by helping to ensure the best possible game occupancy and availability for valued patrons.”
Sean McCreery
Executive General Manager of Table Games
The Star - Sydney
“Due to our ongoing success with Tangam at Sydney, we’re able to deliver the right product at the right time, leading to improvements in efficiency, transparency, decision-making and our bottom line.”
David Croft
General Manager Product & Strategy
