Chapter 1
Why there is the need for data-driven decision making

Most operators already have a Casino Management System (CMS) in place for their hospitality data which is used for patron loyalty programs. Why not utilize the data already being collected to extract valuable information? The data analytics advantage is real and tangible yet some operators don’t exploit their data to turn it into a competitive advantage.
Operators who realize the potential of data, use more advanced tools that allow them to better execute their strategy. These tools typically automate reporting and visualization, while maximizing the benefit from human judgment to make far better decisions.
However, it is important to differentiate between reporting and analytics. Reporting focuses on hindsight i.e. “what happened” while analytics focuses on foresight i.e. “how can we make it happen”. Furthermore, action-oriented analytics are the most valuable e.g. “what specific operational lever can I pull now to improve my table games EBITDA margin by 2% next quarter?”
Difference of Reporting vs Analytics
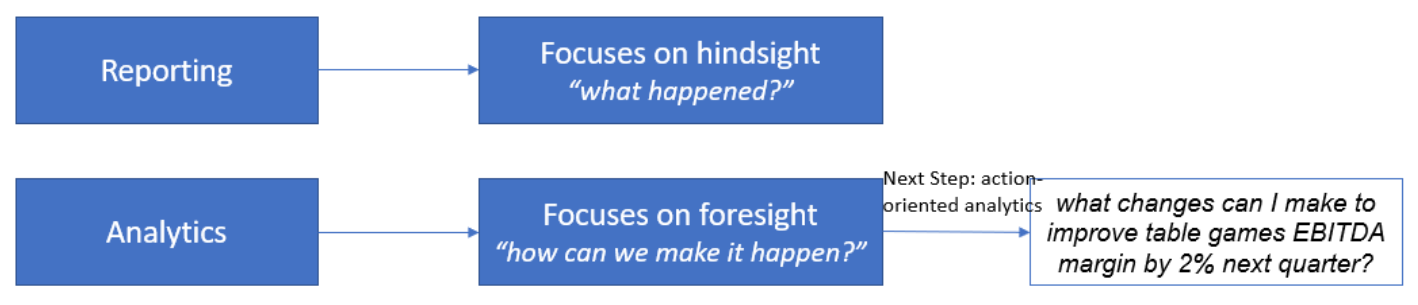
Action-oriented analytics are the most valuable, but require specialized software tools and modeling. This cannot be reproduced with spreadsheets or manual analysis.
COVID-19 has created a mass disruption across the globe with big impacts to the gaming and hospitality industries. Operators have had to deal with long shutdowns, reduced capacity and changes to the gaming floor for new safety regulations. This crisis will likely have long-lasting effects on table game planning and performance. Operators are faced with the same challenge: how to maximize revenues with limited resources?
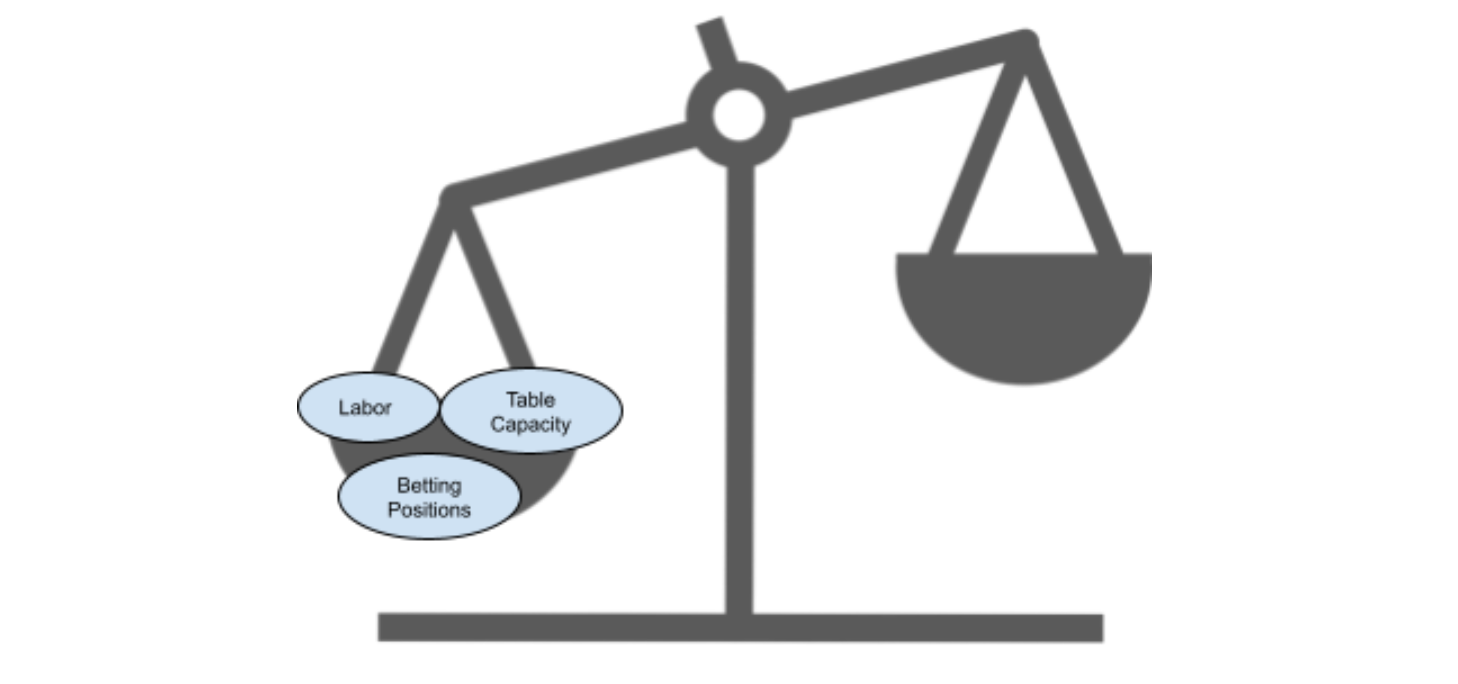
The game preference of the patrons should also be analyzed along with the volume as only reviewing total patron volume is not sufficient. By better segmenting patron demand by game, the operator can better allocate resources. The difference between an optimal and sub-optimal plan could cost the operations 10% or more in missed profit opportunities, either from missed incremental revenue or excessive labor costs.

Heading
In a study conducted by MIT Sloan School of Management professors, they discovered that among the companies surveyed, the ones that were primarily data driven benefited from 4% higher productivity as well as 6% higher profits.
Reporting on Table Games
Key Performance Indicators (KPIs) measure table games’ performance and help unveil what can be changed to make it better. The most effective KPIs are:
